Abundance NY City Council Endorsements
I made this map for Abundance NY ahead of the NYC primaries to share a fun infograph of councilor endorsements, especially for down-ballot races where people may not know the candidates as well. This was mostly an excuse to use Datawrapper, since it is so universally beloved (for good reason!). Also, I'm fully on-board with the Abundance agenda, and have been attending a lot of Abundance NY meetups since returning to NYC.
This was a quick map to build, but I did have to simplify geometries with GeoPandas and convert the shapefile for use in Datawrapper. It also got a lot of views!
Datawrapper has some prerequisites if you're using your own maps.
Prerequisites
To upload your map in Datawrapper, it needs to...
– be in the TopoJSON or GeoJSON format
– be smaller than 2MB
– use the WGS-84 coordinate system (EPSG:4326 projection)
So the first step is to go to NYC City Planning to get the council district shapes:
NYC Planning
.
You can either download them as shapefiles, or just copy the url for "View GeoJSON" if you want to work with GeoJSON off the jump (I'll go through both ways).
Below, I'll walk through all the steps, but if you want to open the walk-through in a MyBinder session and play with the code, you can do that here (takes a minute to load):
NYC City Council Districts - GeoPandas Simplification Walkthrough
Setup
First, import GeoPandas, pandas, and os.
I’ll load the City Council boundaries into a GeoDataFrame directly from the GeoJSON endpoint we got from NYC Planning (url) just to show how to do that. Then I’ll follow up in the next cell with loading them as shapefiles. I’ll also verify the coordinate reference system (CRS), since Datawrapper requires EPSG 4326 (WGS 84).
import geopandas as gpd
import pandas as pd
import os

url = "https://services5.arcgis.com/GfwWNkhOj9bNBqoJ/arcgis/rest/services/NYC_City_Council_Districts/FeatureServer/0/query?where=1=1&outFields=*&outSR=4326&f=pgeojson"
nycc_gdf = gpd.read_file(url)
nycc_gdf.crs
<Geographic 2D CRS: EPSG:4326>
Name: WGS 84
Axis Info [ellipsoidal]:
- Lat[north]: Geodetic latitude (degree)
- Lon[east]: Geodetic longitude (degree)
Area of Use:- name: World.
- bounds: (-180.0, -90.0, 180.0, 90.0)
Coordinate Operation:- name: unknown
- method: unknown
Datum: World Geodetic System 1984 ensemble- Ellipsoid: WGS 84
- Prime Meridian: Greenwich
Great! So that’s already projected in EPSG:4326. I already know it’s 5.5MB, so we’d still have to do simplification to meet Datawrapper’s file size limit, but I’ll show how with the shapefile below.
nycc_gdf = gpd.read_file("data/nycc_25b/nycc.shp")
nycc_gdf.crs
<Projected CRS: EPSG:2263>
Name: NAD83 / New York Long Island (ftUS)
Axis Info [cartesian]:
- X[east]: Easting (US survey foot)
- Y[north]: Northing (US survey foot)
Area of Use:- name: United States (USA) - New York - counties of Bronx; Kings; Nassau; New York; Queens; Richmond; Suffolk.
- bounds: (-74.26, 40.47, -71.51, 41.3)
Coordinate Operation:- name: SPCS83 New York Long Island zone (US Survey feet)
- method: Lambert Conic Conformal (2SP)
Datum: North American Datum 1983- Ellipsoid: GRS 1980
- Prime Meridian: Greenwich
But it’s in EPSG:2263, so let’s reproject it into 4326, and define a little function to save it as a file and also print the file size when we are tinkering with simplification later.
def save_geojson_print_size(gdf, output_path):
    gdf.to_file(output_path, driver="GeoJSON")
    size_mb = os.path.getsize(output_path)/(1024 *1024)
    print(f"{output_path} is {size_mb:.2f} MB")

output_path = "data/nycc.geojson"
nycc_gdf = nycc_gdf.to_crs("EPSG:4326")
save_geojson_print_size(nycc_gdf, output_path)
data/nycc.geojson is 5.54 MB
Simplifying Geometries
So we have to simplify the geometries by more than half. That actually takes a bit of tinkering around. Defining a new gdf on the copy of the original prevents making our iterations lossy (simplifying a geometry that’s already been simplified). We use preserve_topology=True to prevent self-intersecting and invalid geometries.
simplified_gdf = nycc_gdf.copy()
simplified_gdf["geometry"] = nycc_gdf["geometry"].simplify(tolerance=10, preserve_topology=True)  # reduce this tolerance
save_geojson_print_size(simplified_gdf, output_path)
simplified_gdf.plot()
data/nycc.geojson is 0.18 MB
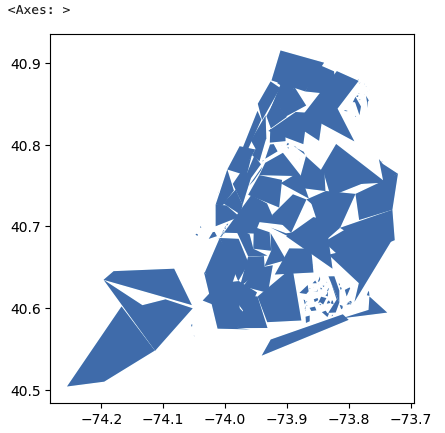
And that is way too simplified! tolerance=10 was too strong.
I found the best tolerance to be tolerance = 0.000006. And that’s it. Your geojson is ready to use.
simplified_gdf = nycc_gdf.copy()
simplified_gdf["geometry"] = nycc_gdf["geometry"].simplify(tolerance=0.000006, preserve_topology=True)  # reduce this tolerance
save_geojson_print_size(simplified_gdf, output_path)
simplified_gdf.plot()
data/nycc.geojson is 1.98 MB
**
From there I just made a simple google sheet with all of the information for the endorsed candidates, including who to also_rank and dont_rank, if valid. Just make sure your first column’s header and formatting exactly match the GeoJSON feature identifier, and that each column uses the same datatype as its corresponding GeoJSON property.
Header and first row below
| CounDist | Endorsed | Name | Incumbency | Tagline | Photo URL | Campaign URL | Neighborhoods | Tooltip Blurb | Also Rank | Don't Rank |
|---|---|---|---|---|---|---|---|---|---|---|
| 1 | TRUE | Jess Coleman | Challenger | Lawyer and Community Activist | Photo Link | Campaign | Battery Park, Financial District, Tribeca, Chinatown, Lower East Side, Soho | Incumbent Christopher Marte voted against City of Yes, opposed affordable senior housing and safe havens, and fought outdoor dining and congestion pricing. | Elizabeth Lewinsohn | Chris Marte |
Connect that as your data source and you can use html to customize the tooltip.
Datawrapper is an incredibly beautiful free tool for visualizations and it’s super easy to use, so I encourage everyone to go play around with it.